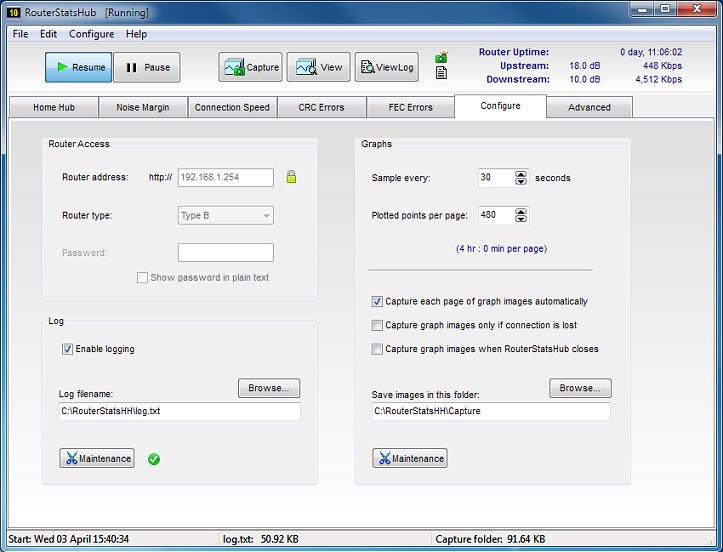
Router Access Panel

Router Address
This is the IP address used to access the Home Hub from a web browser. If you used
the BT CD, this address is usually specified as http://bthomehub/home but,
whether you used the CD or not, 192.168.1.254 is the actual IP
address and works more efficiently.
If you've changed this address in your Home Hub (perhaps to fit in with an existing
local network), you need to 'unlock' this text box before you can enter the new address
into the box. This is achieved by clicking the padlock icon to the right of the box.
Password
If you're using a Home Hub 3 Type A, you can enter the password manually here if you've changed it and
don't want to use the RouterStatsHubsetup wizard.
Log Panel
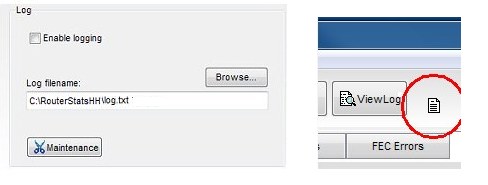
RouterStatsHub is able to save a simple CSV log. Use the Browse...
button to select a suitable folder and choose a filename; then select the
Enable logging checkbox.The file is saved as a
simple text file with the extension .txt
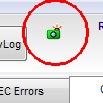
The icon on the toolbar indicates that logging is enabled as shown in the picture,
above right.
Once the file is created, you can use the View Log button on the RouterStatsHub
toolbar, to open the log in Windows Notepad.
Graphs Panel
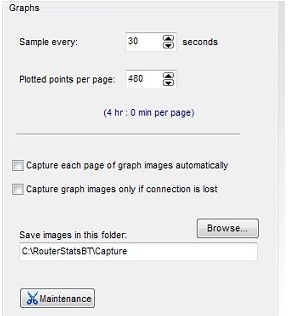
Sample every...
This up/down edit box sets the interval, in seconds, between each sample. The
shortest interval is 10 seconds to avoid excessive load on the Home Hub. The maximum interval is 5 minutes.
Any longer may risk the Home Hub "session" timing out requiring you to log into the Home Hub again.
Plotted points per page
This sets how close together the points are plotted on the graph. Together with
the sample rate it determines how many minutes are displayed on each page of
the graph.
Capture properties
The bottom half of the Graphs Panel is devoted to configuring how graph images are captured. Use the
Browse
button to select a suitable folder. RouterStatsHub automatically creates the
Capture folder inside the main RouterStatsHub folder and I recommend you use that folder exclusively
for RouterStatsHub captured images.
Capture each page of graph images automatically
When this checkbox is selected RouterStatsHub will automatically save each page of the graphs before
they scroll out of view. With the default sample rate and points per page settings, each page will display 4 hours of
plots so the four graphs will be saved once every 4 hours
If this is considered excessive, you can use the Capture graph images only
if connection is lost checkbox instead.
Capture graph images only if connection is lost
When this checkbox is selected, RouterStatsHub will not capture images until the Conection Speed drops to
below 100Kbps. It will then capture the images immediately. RouterStatsHub will then wait until a further
full page has been plotted and capture one more set of images.
The camera icon will appear on the graphs when this "lost sync" occurs. Momentarily press the Pause
and Resume buttons to reset the icon.
These two checkboxes are similar to radio buttons in that both cannot be selected
at the same time (it wouldn't make sense) but, unlike radio buttons, it's possible
to select neither.